︎
News and Editorial Graphics
Elon Musk’s Unmatched Power in the Stars
The New York Times, July 28, 2023 ➝
Mapping the war in Ukraine for the New York Times
More maps of the war in Ukraine ➝
20 Years of Defense, Erased By the Taliban in a Few Months
The New York Times Aug. 14, 2022 ➝
Tracking the California Storms
The New York Times,
Jan. 11, 2023 ➝
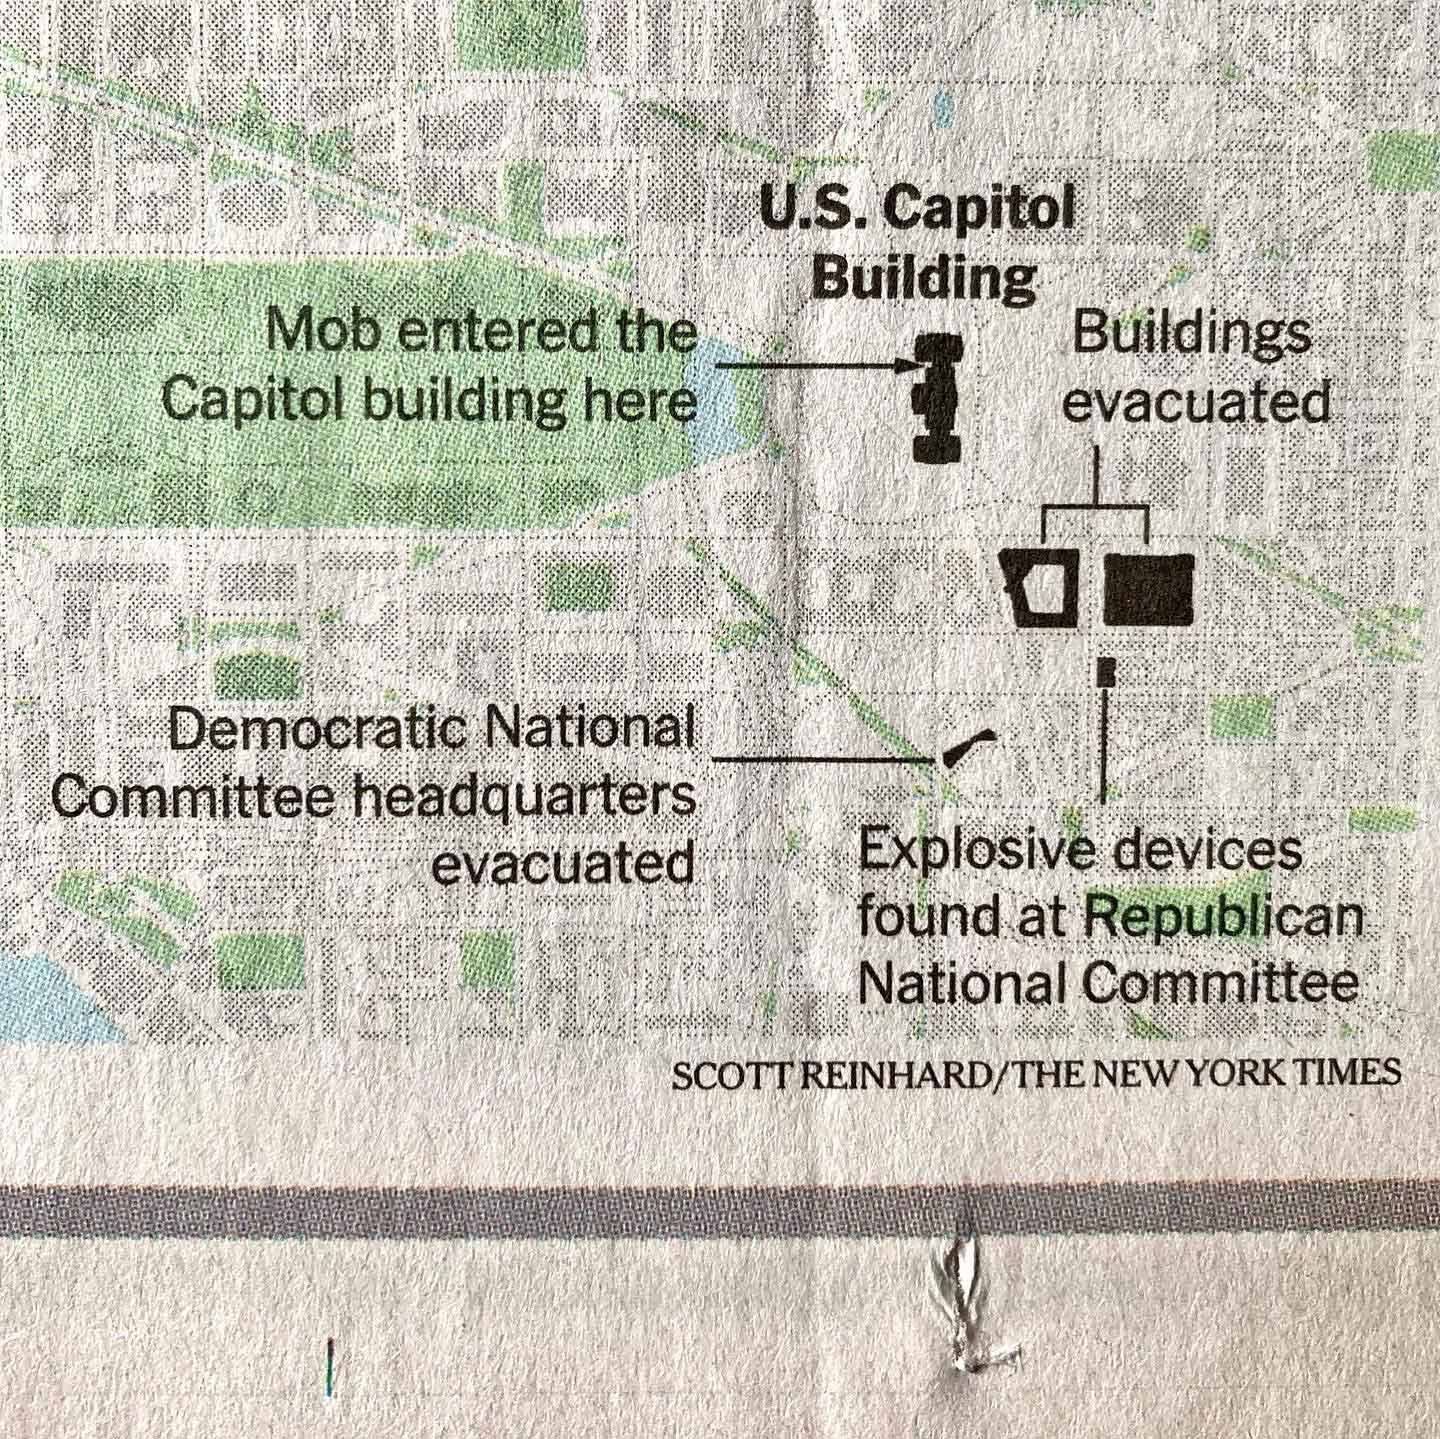
The first map of the Jan. 6 insurrection in the New York Times
What Made This a Record Fire Season? It Started With Lightning
The New York Times, October 2, 2020 ➝
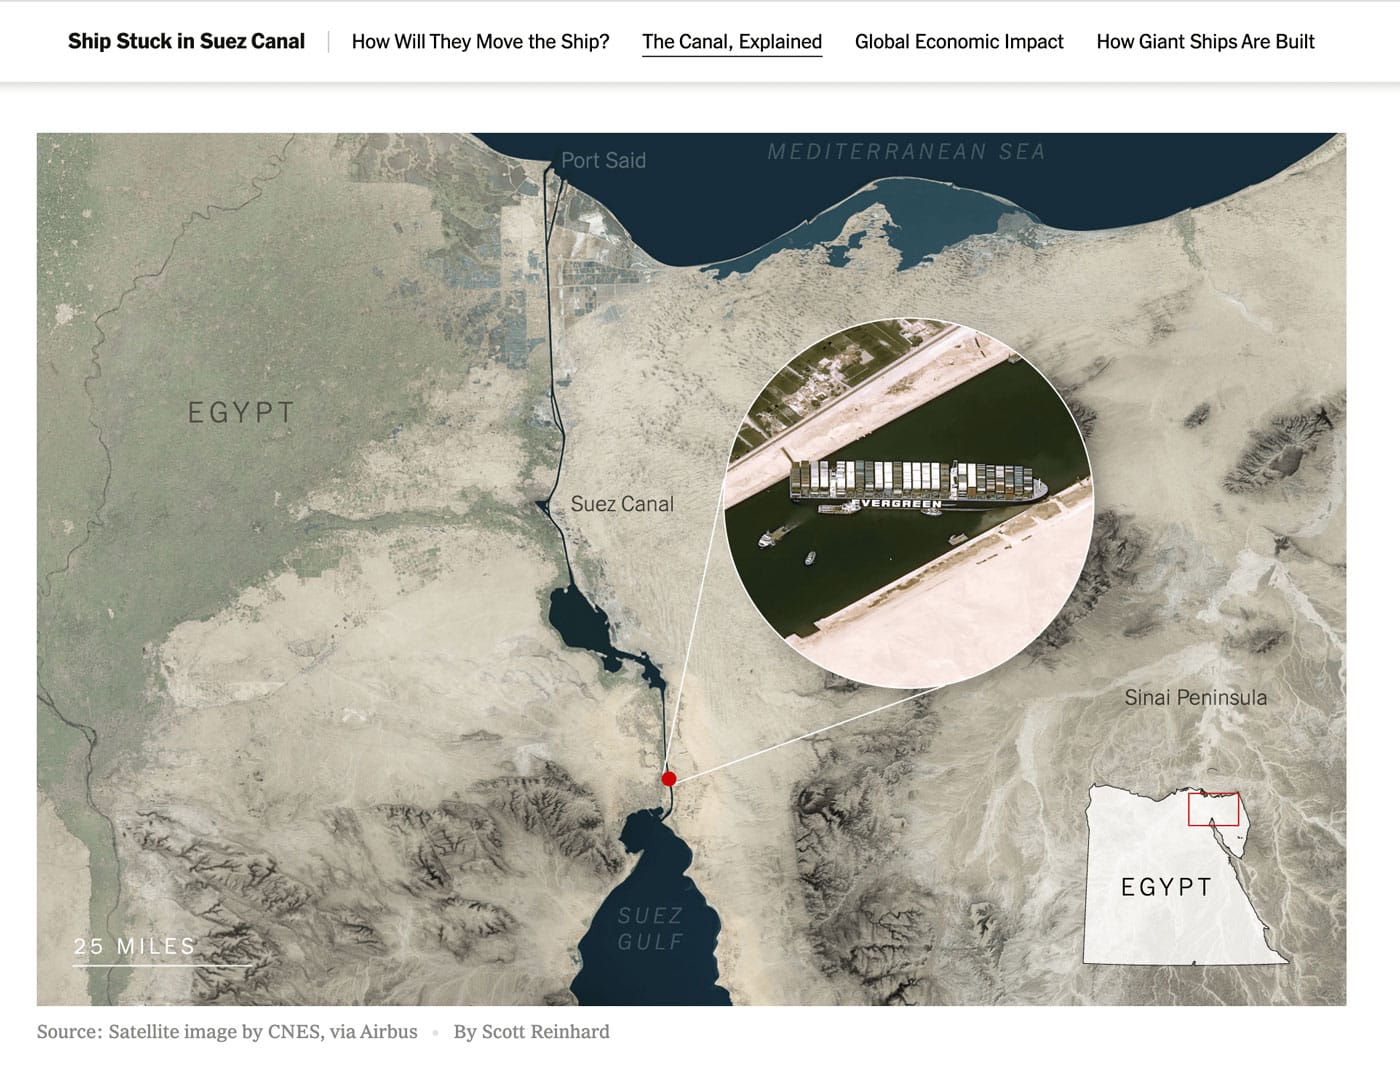
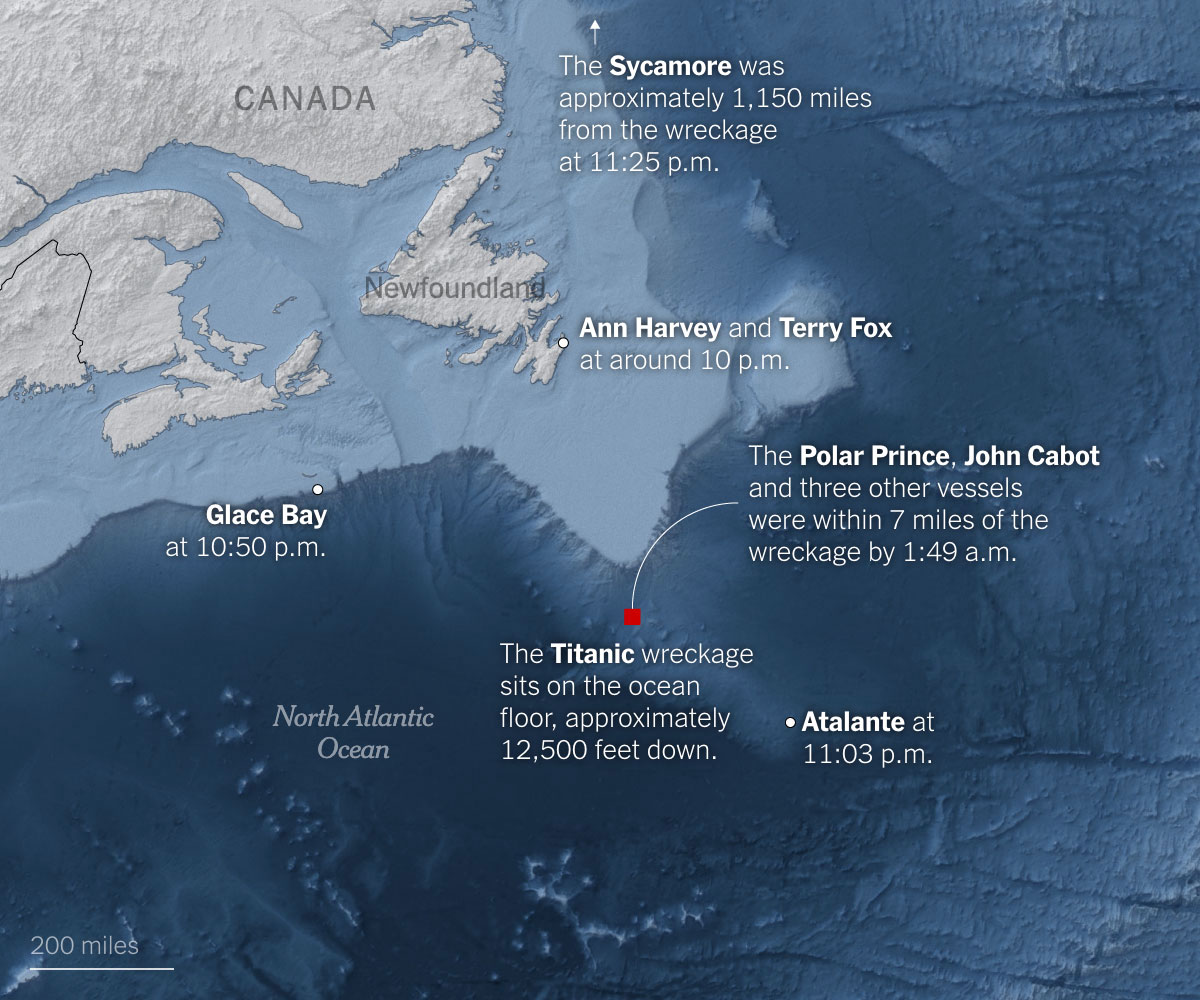
A Closer Look at the Submersible Lost in the North Atlantic
The New York Times
June 21, 2023 ➝
Mapping a First Look at Tonga’s Devastation After the Volcano Eruption
The New York Times
Jan. 21, 2022 ➝
In the Path of the Storm
The New York Times, December 16, 2021 ➝
Arrow map showing 2020 election voting shifts. Published with Sarah Almukhtar, Larry Buchanan, Eleanor Lutz, Bill Marsh, Anjali Singhvi, and Tim Wallace of the New York Times Graphics Desk.
Inside the Massive and Costly Fight to Contain the Dixie Fire
The New York Times, O
ctober 11, 2021
Map: Where Ida Has Left Louisiana and Mississippi Without Power
The New York Times, September 3, 2021 ➝
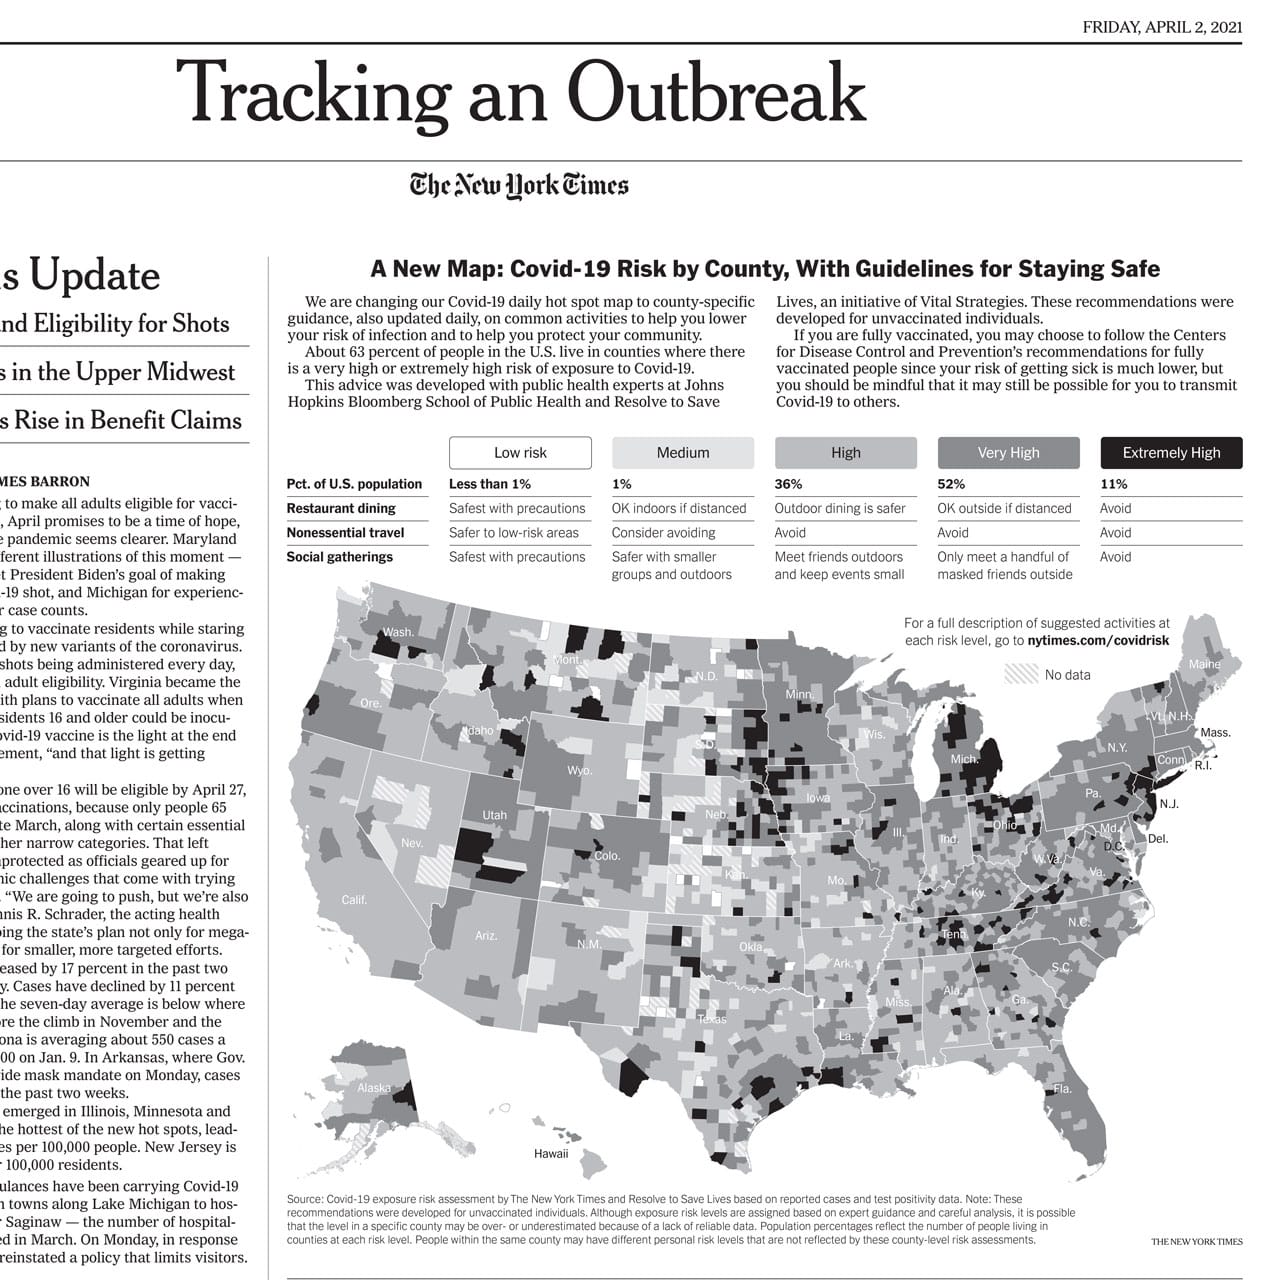
Covid-19 Risk by County
The New York Times, daily map in print edition
The Epicenter
The New York Times, December 3, 2020 ➝
The Amazon That Customers Don’t See
The New York Times, June 15, 2021 ➝
Why the Suez Canal Is So Important
The New York Times, March 26, 2021 ➝
Mapping the Whitney Biennial
The New York Times, July 5, 2019 ➝
Mapping the Whitney Biennial
Melting Greenland Is Awash in Sand
News Graphics
The New York Times, July 1, 2019 ➝
A New $260 Million Park Floats on the Hudson. It’s a Charmer.
The New York Times, May 20, 2021 ➝
Mapping the Damage From the Beirut Explosion
News Graphic and Analysis. The New York Times, August 4, 2020 ➝
The Root of Haiti’s Misery: Reparations to Enslavers
The New York Times,
May 21, 2022 ➝